The good: Nolan Gorman lately; the bad: center field all season
Ah, the duality of the 2024 St. Louis Cardinals
I’m thinking about a couple of things this week as the Cardinals head home for what’s theoretically a soft stretch of upcoming schedule …
Nolan Gorman levels up
Vibes have worsened modestly across the just concluded road junket, but a pleasing exception continues to be Nolan Gorman’s surge at the plate. Gorman boasts a seasonal slash line of .230/.314/.497, which is good for a wOBA of .344. He’s got an OPS+ of 134, and that compares quite favorably to his pre-2024 OPS+ of 11. This is strong production overall, particularly for a 24-year-old second baseman. It’s all driven by that recent surge.
To select an endpoint that’s entirely convenient to these purposes but sounds reasonable enough, we’ll go with May 10. At the close of play on May 9, Gorman was lugging around a slash line of .172/.256/.319 with four home runs and 13 walks in 129 plate appearances. Since then, though, he’s slashing .324/.407/.789 with 10 home runs and 10 walks in 81 plate appearances (he was a combined five feet or so from hitting two more homers on Wednesday). Gorman’s plate game – lots of swing and miss and lots of power – lends itself to streakiness, so these kinds of performance swings are probably going to be customary for him. Still, there are some signs of growth here, and it has largely to do with plate discipline. Consider:
Gorman up until May 10 this season had a chase rate – i.e., how often he swung at pitches outside the strike zone – of 33.3%. Since then, his chase rate has dropped to 26.3%.
Across those same two samples, he’s dropped his swinging-strike rate from 19.8% to 17.3%.
Overall, since May 10 Gorman has swung at pitches 43.8% of the time versus a 51.9% swing rate leading up to May 10. The significantly more restrained approach comes despite the fact that across his recent hot streak he’s seen a slightly higher rate of pitches classified as being in a “competitive location.”
Gorman’s pitches per plate appearance has ticked up from 3.96 across our first sample to 4.15 in these more recent weeks.
His walks as a percentage of plate appearances have increased from 10.1% before his surge to 12.3% since then.
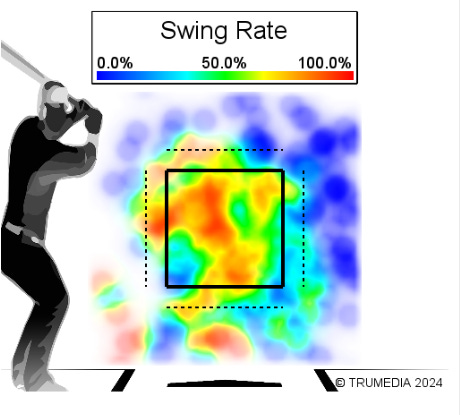
The sample-size concerns are duly noted, but across this limited stretch this looks like a player who’s learning what kinds of pitches he can drive for damage. Here’s what that looks like visually. First, a heat map of Gorman’s swing percentages through May 9:
And here’s since May 10:
Gorman’s done a much better job of laying off pitches up and up-and-in, which is a location that’s too often tempted him throughout his big-league career. He’s also getting fooled less inside off the plate.
All of this would mean little if Gorman weren’t turning improved discipline into improved contact. Indeed, Gorman since May 10 relative to the start of the season has added more than 5 mph to his average exit velocity, increased his hard-hit rate from 34.2% to 43.9%, and upped his rate of “barrels” from 20.5% to 29.3%. He’s also added more than 18 feet to his average fly-ball distance. He’s pulling the ball 58.5% of the time against a figure of 41.1% before May 10, and he’s dropped his ground-ball percentage from 35.6% to 22%. Prior to our first cutoff date, Gorman homered one every 29 at-bats. Since then, he’s homered every 7.1 at-bats. Most essentially, Gorman’s expected wOBA has vaulted from .281 before May 10 to .445 since then.
Obviously, these trends could be arrested and reversed at any moment, and as noted I expect that some degree of streakiness will be a Gorman hallmark for years to come. However, the fact that his surge is underpinned by a much more selective approach at the plate raises the possibility that this is genuine growth on his part as opposed to “just” a heater. We’ll see about that in the weeks to come.


